These results are from a book chapter I’m preparing on the role of land and property rights in Haiti’s economic development. I’ll release the working manuscript in the near future, but I wanted to highlight some results before its release. The previous posts have looked at farm size and land inequality.
In my previous post, I established that farm sizes in Haiti were small. As a result, land inequality in Haiti is much lower than in neighboring Caribbean countries. But I was curious in whether farms were getting smaller over time. That’s something we could not do with the 1950 census, our previous best data on Haitian land. But with these new samples, we might be able to say something.
The new Haitian land data has samples of plots over a 40-year period from 1920 to 1960. That’s at least a generation of land use. This gives us our first opportunity to look at whether farm sizes are changing over time.
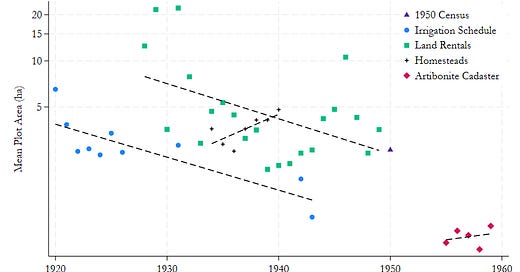
In the figure below, I show the mean plot by each sample year. The points are grouped by source, and the y-axis is scaled logarithmically.
The first observation is that there is a general decrease in plot size over the 40-year period. But I don’t like putting too much weight on that initial observation because the latest dataset, the Artibonite cadaster, has by far the smallest plots, but that could be because the selection into that sample is different than the others.
That’s why the graph also has the within-sample trend lines. While the homestead program shows an increase over the years it ran, the two largest samples, the irrigation schedules and public land rentals, show steep declines. Incidentally, extending the two trends puts them right on target for the small Artibonite plots.
So let’s advance assuming the farms are getting smaller over time. Why are they getting smaller?
The Policy Experiment
Across the world, one hypothesis is that government implement policies that favor small plots. For example, Brazil taxed land progressively, the Philippines put a ceiling on land ownership, and Zambia subsidized farms smaller than a hectare. Perhaps Haiti had some similar policies.
Fortunately, there was one. And we can observe it change.
In 1913, the government passed an irrigation tax. It was originally set in 1913 at 1 Haitian gourde for every irrigated carreau (1 cx = 1.29 ha), but it exempted any farms that were smaller than 2 cx. By the 1930s, the revenue covered less than 20% of annual maintenance costs, and in some years covered less than 7% . Maintenance expenditures were a transfer to the irrigated farmers from the rest of the population.
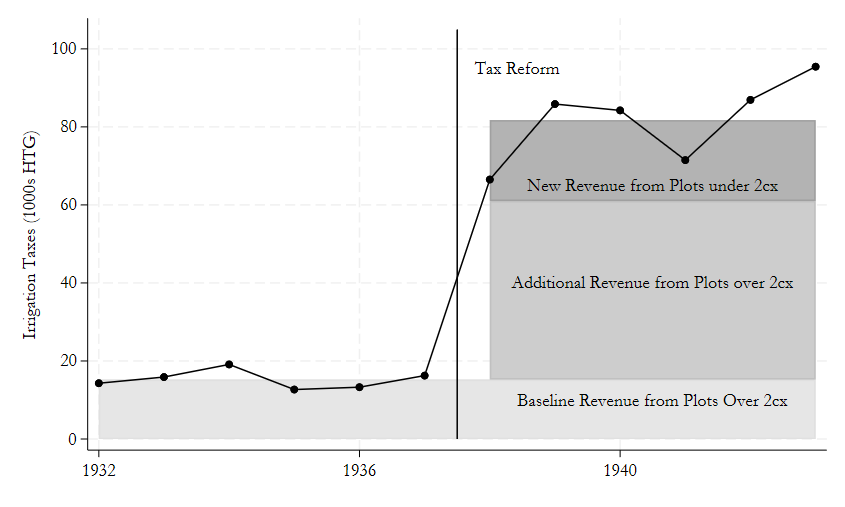
In 1938, tax was reformed to remedy what American officials called “the most inequitable tax on the Haitian statute books.” It was increased in 1938 to 4 HTG for every irrigated carreau, and all exemptions were eliminated. This significantly increased the tax’s revenue, as seen in the figure below, and, combined with efforts to reduce maintenance costs, led to revenue more than doubling expenditures in 1943.
By not taxing smaller plots, this policy favored small farms. But it is hard to estimate how much it distorted the farm size of irrigated land. Since the tax exempted farms under 2 cx, farmers could avoid it by operating smaller farms. But it is hard to estimate how much of the land fell below this threshold. The irrigation schedules show that before 1938 farms under 2 carreaux accounted for 78% of properties. A 1932 report, however, claimed that exempted farms accounted for 40% of irrigated land. And the change in tax revenues gives another answer. Since all land after 1938 is taxed at the rate of 4 HTG/cx, then dividing the post-1938 revenue by four and subtracting the pre-1938 revenue will reveal how much taxed land was under 2 cx. This operation, graphically displayed in the figure below, shows that small farms were 25% of irrigated land. This wide range of estimates makes it difficult to draw any conclusions.
But even if we can’t look at how much this directly distorted farm size, the change in policy should give us an idea.
Response to the Experiment
Since the initial tax was biased towards small farms, the tax reform should lead to a reallocation of land. Ideally, we would look at similar plots nearby and do a difference-in-differences design to get at the causal effect of the policy. Unfortunately, the reform was enacted simultaneously across all irrigated land, so there is no opportunity for treatment variation to get a causal effect. But a basic prediction is that if the tax distorted farm sizes to be smaller than optimal, then after the reform the average farm size should rise. That’s something we can look at.
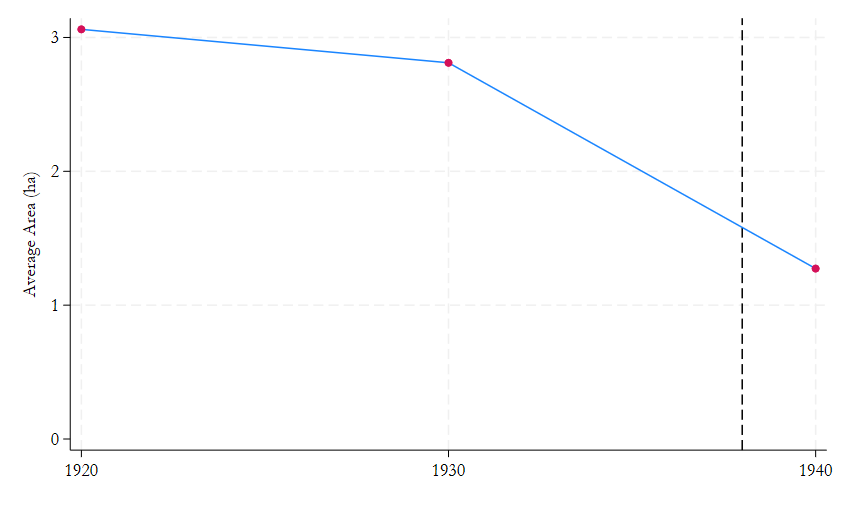
In the figure below, I look at average farm size by decade in the irrigation data. The plots observed in the 1920s were around 3 ha, and in the 1930s they were just below 3 ha. But in the 1940s, just after the reform, the average plot had dropped more than half, just above 1 ha.
This is not because the small plots are now seen. The irrigation schedule always included the plots under 2 carreaux (2.58 ha). The plots after the reform are smaller than the ones before.
To be clear, this is not a causal effect. Indeed, the right counterfactual could be a world where the average plot size is even smaller, such that the reform truly did increase farm sizes. But it does tell us something.
Why farms are getting smaller
I think this natural experiment is interesting because it’s a force pushing to increase plot size, but it is overwhelmed by an opposing force. There’s something stronger than policy pushing farms to become smaller over time.
The opposing force is probably the traditional institutions that subdivided plots over generations and gave extended family veto rights over transfers. I’ll write on the problems this caused in a future post.


